Inventory dashboard
Overview
The inventory dashboard is a one-screen snapshot of the warehouse: how many SKUs are active, how many units are on hand, how many locations are occupied, how stock is split across states (available, reserved, damaged, quarantine…) and across customers, and which products moved the most in the last month. The most common operations start right from here.
It is a read-only screen: nothing you see here changes inventory, creates charges or notifies anyone. Everything it shows belongs to the active warehouse (the one selected at the top right).
Before you start
- Module: the warehouse must have the Inventory module. Without it, the stock group does not appear in the menu. See Modules, permissions and access.
- Permission: View Inventory. By default the Super Admin, Admin, Supervisor and Worker roles have it. The menu item is also shown to someone who only has Manage Inventory Catalogs, but the page requires View Inventory: without it, the system refuses the page with an access denied message.
- Data: the dashboard fills in as products, zones, locations and confirmed receipts exist. In a new warehouse everything shows zero.
Getting there
In the top bar open Inventory and, in the side menu, choose Inventory KPIs, the first option of the stock group (above Stock, Adjustments, Cycle counts and Transfers).
Quick actions
The top strip has six shortcuts. Each one appears only if you have the permission to use it:
- Create Product — opens the new product form (Manage Inventory Catalogs). See Products and packaging levels.
- Create Zone and Create Location — open a pop-up to add one without leaving the dashboard (same permission). See Locations and zones.
- Inventory Adjustment — opens a blank adjustment form (Adjust Inventory).
- Change Inventory Status — opens a blank status change (same permission).
- View Stock — goes to stock by location.
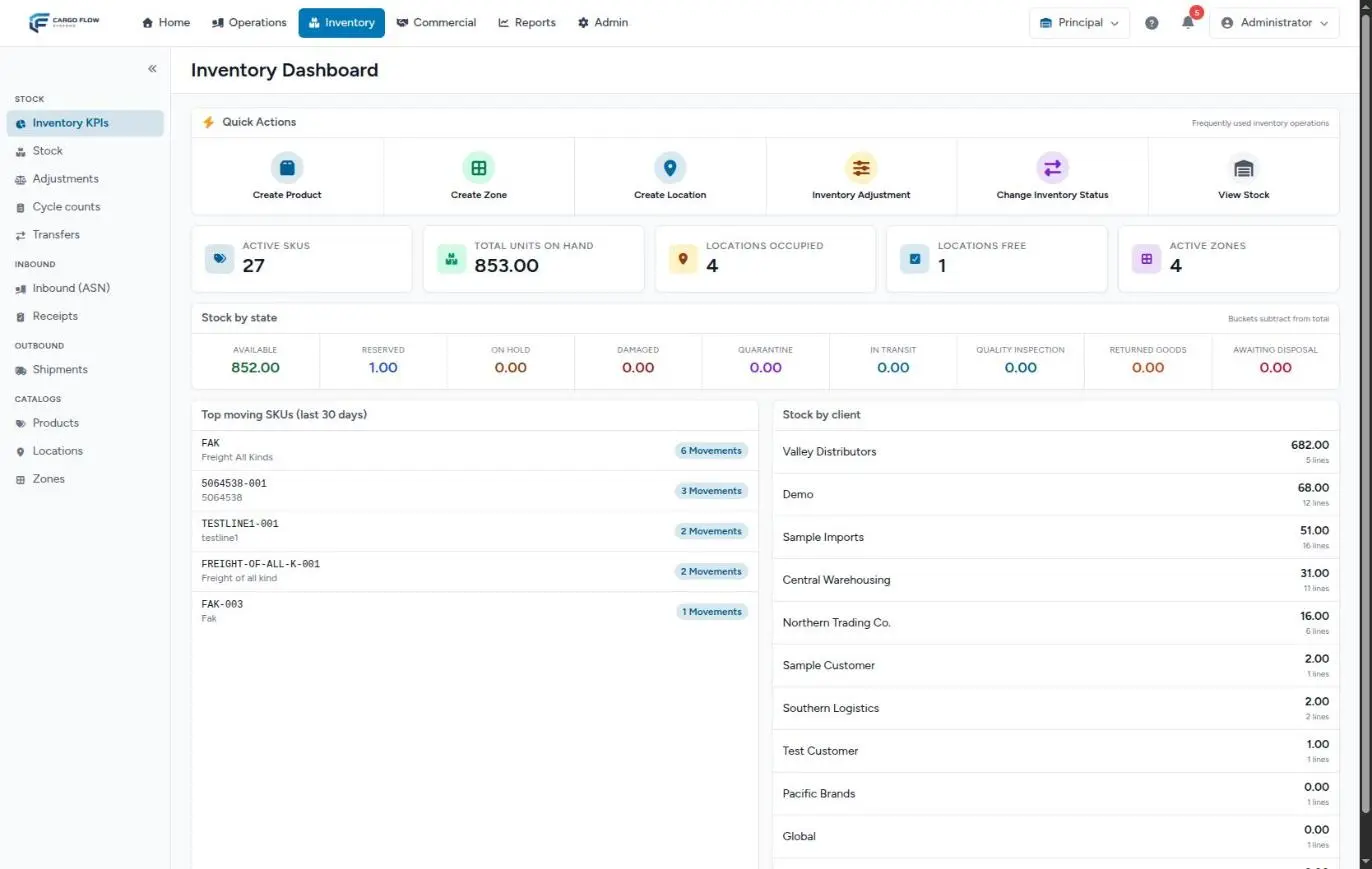
The five indicators
| Indicator | What it counts |
|---|---|
| Active SKUs | Catalog products marked active, for every customer plus the global ones. It includes active one-time items, even though the product list hides them. |
| Total units on hand | The sum of the quantity of every stock line, in each product’s base unit. It includes reserved and blocked quantities. |
| Locations occupied | Locations with at least one line whose quantity is above zero. |
| Locations free | Active locations minus the occupied ones. Never below zero. |
| Active zones | Zones marked active. |
Stock by state
The state bar splits the warehouse units into nine boxes. They all come out of the same total: anything in a state other than Available is subtracted from what you can promise.
- Available — free to reserve and ship. It is not stored separately: it is the total minus every other box.
- Reserved — set aside by shipments that already reserved and have not left.
- On hold, Damaged, Quarantine, In transit, Quality Inspection, Returned Goods and Awaiting Disposal — goods that are in the warehouse but blocked for some reason.
What each state means, which system action puts goods in or takes them out, and how to move them by hand is in Changing the status of goods.
Top moving SKUs and stock by customer
- Top moving SKUs (last 30 days) — the five products with the most recorded movements in the last month: receipts, shipments, adjustments, transfers and status changes. It counts movements, not units: a product with many small shipments ranks above one with a single large shipment. A transfer counts twice (out of the source and into the destination).
- Stock by client — how many units and how many lines the warehouse holds for each customer, largest first. Stock without a customer shows as Global. The line count includes lines that are already at zero and have not been cleaned up yet (see below).
Example: reading the dashboard on a Monday
The warehouse supervisor opens the dashboard at 7:00 and sees:
| Data | Value | What it says |
|---|---|---|
| Locations free | 6 of 240 | Two trailers from Valley Distributors arrive Thursday with 40 pallets. They will not fit: re-slot or consolidate today. |
| Damaged | 312 | Last week it was 180. Filter Stock for lines with damaged above zero to see whose they are. |
| Reserved | 1,450 | There are reserved shipments that have not left; compare with the shipment list to spot one that is stuck. |
| Stock by client | Northern Trading Co.: 18,200 in 96 lines | The customer with the most volume; its next cycle count is best done by zone. |
Where the numbers come from
The dashboard has no data of its own: it reads what the other operations leave behind.
- Confirmed receipts add units and occupy locations. See From notice to stock.
- Shipments raise Reserved when they reserve and lower units when they close. See From order to departure.
- Adjustments, status changes, transfers and approved counts move the state boxes and the totals. See The life of stock.
- Every night at 1:30 (server time), the system deletes lines that are at zero, with nothing reserved and no movement in the last 7 days. That is why a customer’s line count can drop overnight without anyone doing anything.
What the dashboard does not count
- Warehouse-to-warehouse transfers on the way: the goods already left the source warehouse and have not entered the destination, so they count in neither. See Stock transfers.
- Value: the dashboard shows no amounts. Unit cost is visible only to users with the valuation permission, on each product.
- Expiry and low stock: they are not on this dashboard. They appear as KPIs on the KPI dashboard (see Reorder point and low stock and Lots, serial numbers and expiry).
- Inactive locations holding goods: they count as occupied but are not part of the free count (free is calculated only over active locations). If you deactivate locations with goods in them, free looks lower than it is.
- The cross-dock zone: goods passing through the cross-dock location do count in units and occupied, even though they are not stored.
Best practices
- Start the shift on the dashboard: you spot blocked goods (damaged, quarantine, on hold) that someone has to resolve.
- Check locations free before accepting a large appointment: if it is close to zero, re-slot or ask for space before the truck arrives.
- Compare Reserved against the day’s shipments: a reservation that does not drop for days is usually a shipment that was never closed.
- Use Top moving SKUs to decide which products go in the locations closest to the dock.
Troubleshooting
Available is lower than what I see on the floor.
- Part of the goods is reserved by shipments or in a blocked state (damaged, on hold, quarantine…). The state bar shows how much is in each.
Goods that were just unloaded do not show.
- The receipt is not confirmed yet: goods enter inventory only when the supervisor confirms the receipt. See Capture and review.
Some quick actions are missing.
- Each shortcut shows only with its permission. Create Product, Zone and Location need Manage Inventory Catalogs; adjustment and status change need Adjust Inventory; View Stock needs View Inventory.
I see the menu item but get access denied.
- You have Manage Inventory Catalogs but not View Inventory. Ask an administrator to add View Inventory (see Roles and permissions).
Active SKUs is higher than the products I see in the list.
- The product list hides one-time items; the indicator counts them. Tick Show one-time items in the list to see them.
Frequently asked questions
Does the dashboard refresh on its own?
No. The numbers are calculated every time you open or reload the page, with the movements recorded up to that moment; there are no nightly cut-offs. If you left the screen open, reload it to see the latest.
Can I export what the dashboard shows?
The dashboard has no export. The customer-facing lists are in Reports › Inventory Reports: the item list in Excel, inventory by location in PDF and a customer’s inventory with transactions in PDF or Excel. See WMS reports.
Does the dashboard add up all my warehouses?
No. It shows only the active warehouse. To see another one, switch it with the warehouse selector in the top bar (see Changing language and warehouse).
Does the customer see this dashboard?
No. It is internal. The customer sees their own inventory, with age per SKU, in the client portal (see Inventory and KPIs in the portal) plus whatever KPIs the warehouse chooses to show them.
Need help?
If something did not work as expected, our support team can help you.
Was this article helpful?