Reading the KPI dashboard
Summary
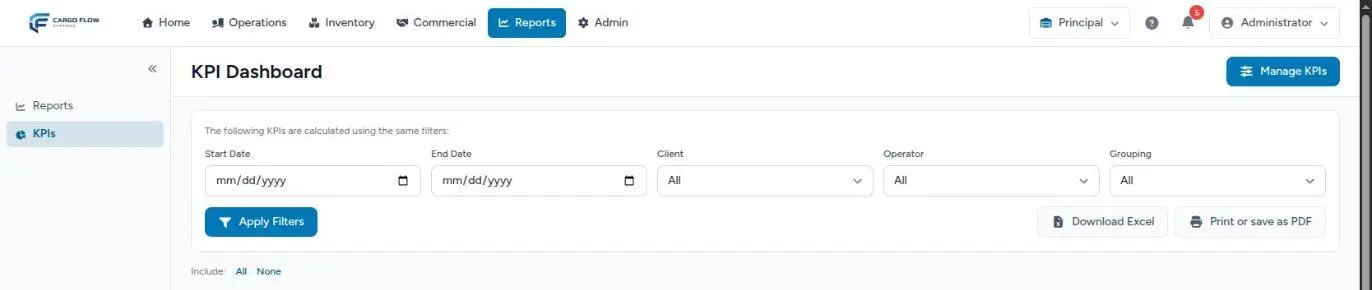
The KPI dashboard brings together on one screen the numbers the warehouse operation is measured by: on-time shipping, fill rate, accuracy, processing times, occupancy and throughput. It is under Reports › KPIs, titled KPI Dashboard.
Each card computes its number separately from what has already happened in the operation: confirmed receipts, closed shipments, cycle counts, dock jobs, invoices. Nobody enters KPIs by hand. Exactly what each one measures is in the family articles (see below).
Before you start
- Module: the warehouse needs the KPI module. Each card also needs the module its data comes from (receiving, shipping, inventory, docks or billing): without it, the card does not show.
- Permission: View KPIs, which admins and supervisors have by default. Workers and accounting do not. See Roles and permissions.
- Some cards need their own permission: inventory value needs the valuation permission (admin); revenue and receivables need the billing view permission (admin and accounting).
The starter board
The first time someone opens the dashboard in a warehouse, the system builds a board with the most used cards for the modules the warehouse has: up to 24 if it has all of them. You do not start from a blank screen, and you do not see cards for modules you do not have. These cards carry the Preset badge, use the last 30 days and the industry benchmark as target. If another module is subscribed later, its cards appear the next time someone opens the dashboard.
To add, change or hide cards, see Building a KPI board.
How to read a card
Each card has:
- The name and, below it, its category and the date range it uses (for example, Operations · Last 30 days). Point-in-time cards show no range.
- The Preset badge if the system seeded it.
- The value: a number, or a line, bar or donut chart.
- The target (Target: 97.0%) when the metric has one.
- The comparison with the previous period of the same length (-5.0 pts vs. previous period).
- A checkbox in the corner, which decides whether the card goes into the printout.
If there was no activity in the range, the card says No data for this range. That is not an error: there is nothing to measure. If it says You do not have access to this KPI, you are missing that metric's own permission.
Cards are grouped in two blocks: Performance (what has a target and can be met or missed) on top, and Warehouse status (how much there is and how much moved) below. Within each block the presets come first.
Colors, targets and comparison
- Green: meets the target. Red: misses it. Amber: between the target and the warning threshold, if the card has one.
- The system knows which direction is better for each number: for compliance percentages, higher is better; for times, days on hand or late shipments, lower is better. That is why a number going down can be green.
- The target comes, in this order, from the target agreed with the filtered customer, the target you set on the card, or the industry benchmark. If none exists, the card is not colored: better no color than a made-up threshold.
- Only single-number cards get a color. Charts do not.
- The previous-period comparison uses the window right before, of the same length. Percentages show points (+2.0 pts); everything else shows percent change. Green if the change is an improvement, red if it is a setback. It does not appear if the previous period was zero, nor on point-in-time metrics.
How values are displayed
| Value type | Looks like |
|---|---|
| Percentage | 97.0% |
| Hours, minutes, days | 3.2 h · 45 min · 18 d |
| Units | 12,480 u |
| Units per hour | 310 u/h |
| Money | $1,234.56 |
| Counts | The plain number. |
What each family measures
| Family | Typical cards | Detail |
|---|---|---|
| Shipping | On-time shipping, fill rate, complete and on time, order cycle time, warehouse processing, late shipments, short lines. | See |
| Receiving and quality | Receiving accuracy, on-time arrivals, dock-to-stock time, damaged units, discrepancies, inventory accuracy. | See |
| Inventory and throughput | On-hand units, active SKUs, aging, occupancy, turns, days on hand, expiring soon, receipts and shipments per period. | See |
| Dock and billing | Cycle time, carrier wait, dock SLA compliance, transactions, units per hour, revenue and receivables. | See |
Filtering the dashboard
The bar at the top ("The following KPIs are calculated using the same filters") applies the same filters to every card at once:
- Start Date and End Date — replace each card's own range, which then reads From … to …. The day cut-off is in warehouse time. Point-in-time metrics (stock, aging, occupancy, receivables, late shipments) do not change with the dates: they always show today.
- Client — limits everything to one customer's goods and uses their agreed target if they have one. Cards that cannot be split by customer (occupancy, expirations, ABC, transactions by operator or by customer) ignore it without saying so.
- Operator — limits to what one person did (see below).
- Grouping — day, week or month, for chart cards.
- Tap Apply Filters. With filters active, Clear appears to go back to the normal dashboard.
The operator filter
Only dock jobs and inventory movements record who did them. When filtering by operator, the other cards leave the dashboard and a blue notice says "These KPIs cannot be narrowed to an operator, so they were left out: …". If no card on the board can be narrowed, the notice says so.
Getting the report: Excel and PDF
- Download Excel — downloads a file with every card you can see, with the filters applied. The Summary sheet has, per single-number card: metric, category, value, target, status against the target and previous period, plus the generation date and the range. Each chart card gets its own sheet, with label and value.
- Print or save as PDF — opens the browser print dialog with a cover page: logo, KPI Report, warehouse, range, client, operator, grouping and generation date. To save as PDF, choose "Save as PDF" as the printer.
- Include: All / None and each card's checkbox decide which cards go into the printout.
Example: the monthly review with a customer
- Start date September 1, end date September 30, client Northern Trading Co., grouping by week. Apply Filters.
- On-time shipping shows 94.1% in red (target 97%), with -2.3 pts vs. previous period: of 34 shipments requested in September, 32 left on time.
- Receiving accuracy shows 99.4% in green.
- You uncheck the dock and occupancy cards, which the customer does not care about, and print to PDF.
- Before the meeting you open the month's shipping report to have the two late ones at hand. See Warehouse reports.
If the customer gets a monthly summary by email, the numbers should match this one: see KPIs for the customer.
Good practices
- Always compare full periods of the same length: months against months.
- If a card is red, open the matching report before drawing conclusions: a single late shipment moves a percentage a lot when volume is low.
- Enter dates properly in the operation (requested ship date, expected arrival on the notice, actual received date): without them, several KPIs do not count that document.
Troubleshooting
A card says "No data for this range".
- There was no activity of that kind in the chosen dates, or the client filter left nothing. Widen the range or clear the filter.
A "Number card" card is empty even though there is activity.
- It is a chart metric (per period or by type) set as a number card: that way it does not draw. Edit it and change the type to line, bar or donut.
Filtering by operator made almost every card disappear.
- That is correct: only dock and inventory movement metrics know who did the work.
I applied filters and nothing changed.
- Check the dates: end before start, or end only, are not applied.
I do not see a card my coworker sees.
- The card is limited to certain roles, or the metric needs a permission you lack.
The dashboard takes a while to fill.
- Each card computes separately, so the page opens right away and the data arrives card by card. A multi-month range grouped by day takes the longest.
Frequently asked questions
Some cards have Spanish names
Each preset card name is stored once, in the language of the person who first opened the dashboard (or the client portal) in that warehouse. If that person used the system in Spanish, the cards keep Spanish names for everyone, also in the Excel, the portal and the customer's monthly summary. An admin can fix it by editing each card in Manage KPIs and changing its name.
Does my customer see these numbers?
Only cards marked Show in client portal, always limited to their own goods. They can also get a monthly summary by email. See KPIs for the customer.
Need help?
If something did not work as expected, our support team can help you.
Was this article helpful?